Dashboards
Flowdapt workflow dashboard
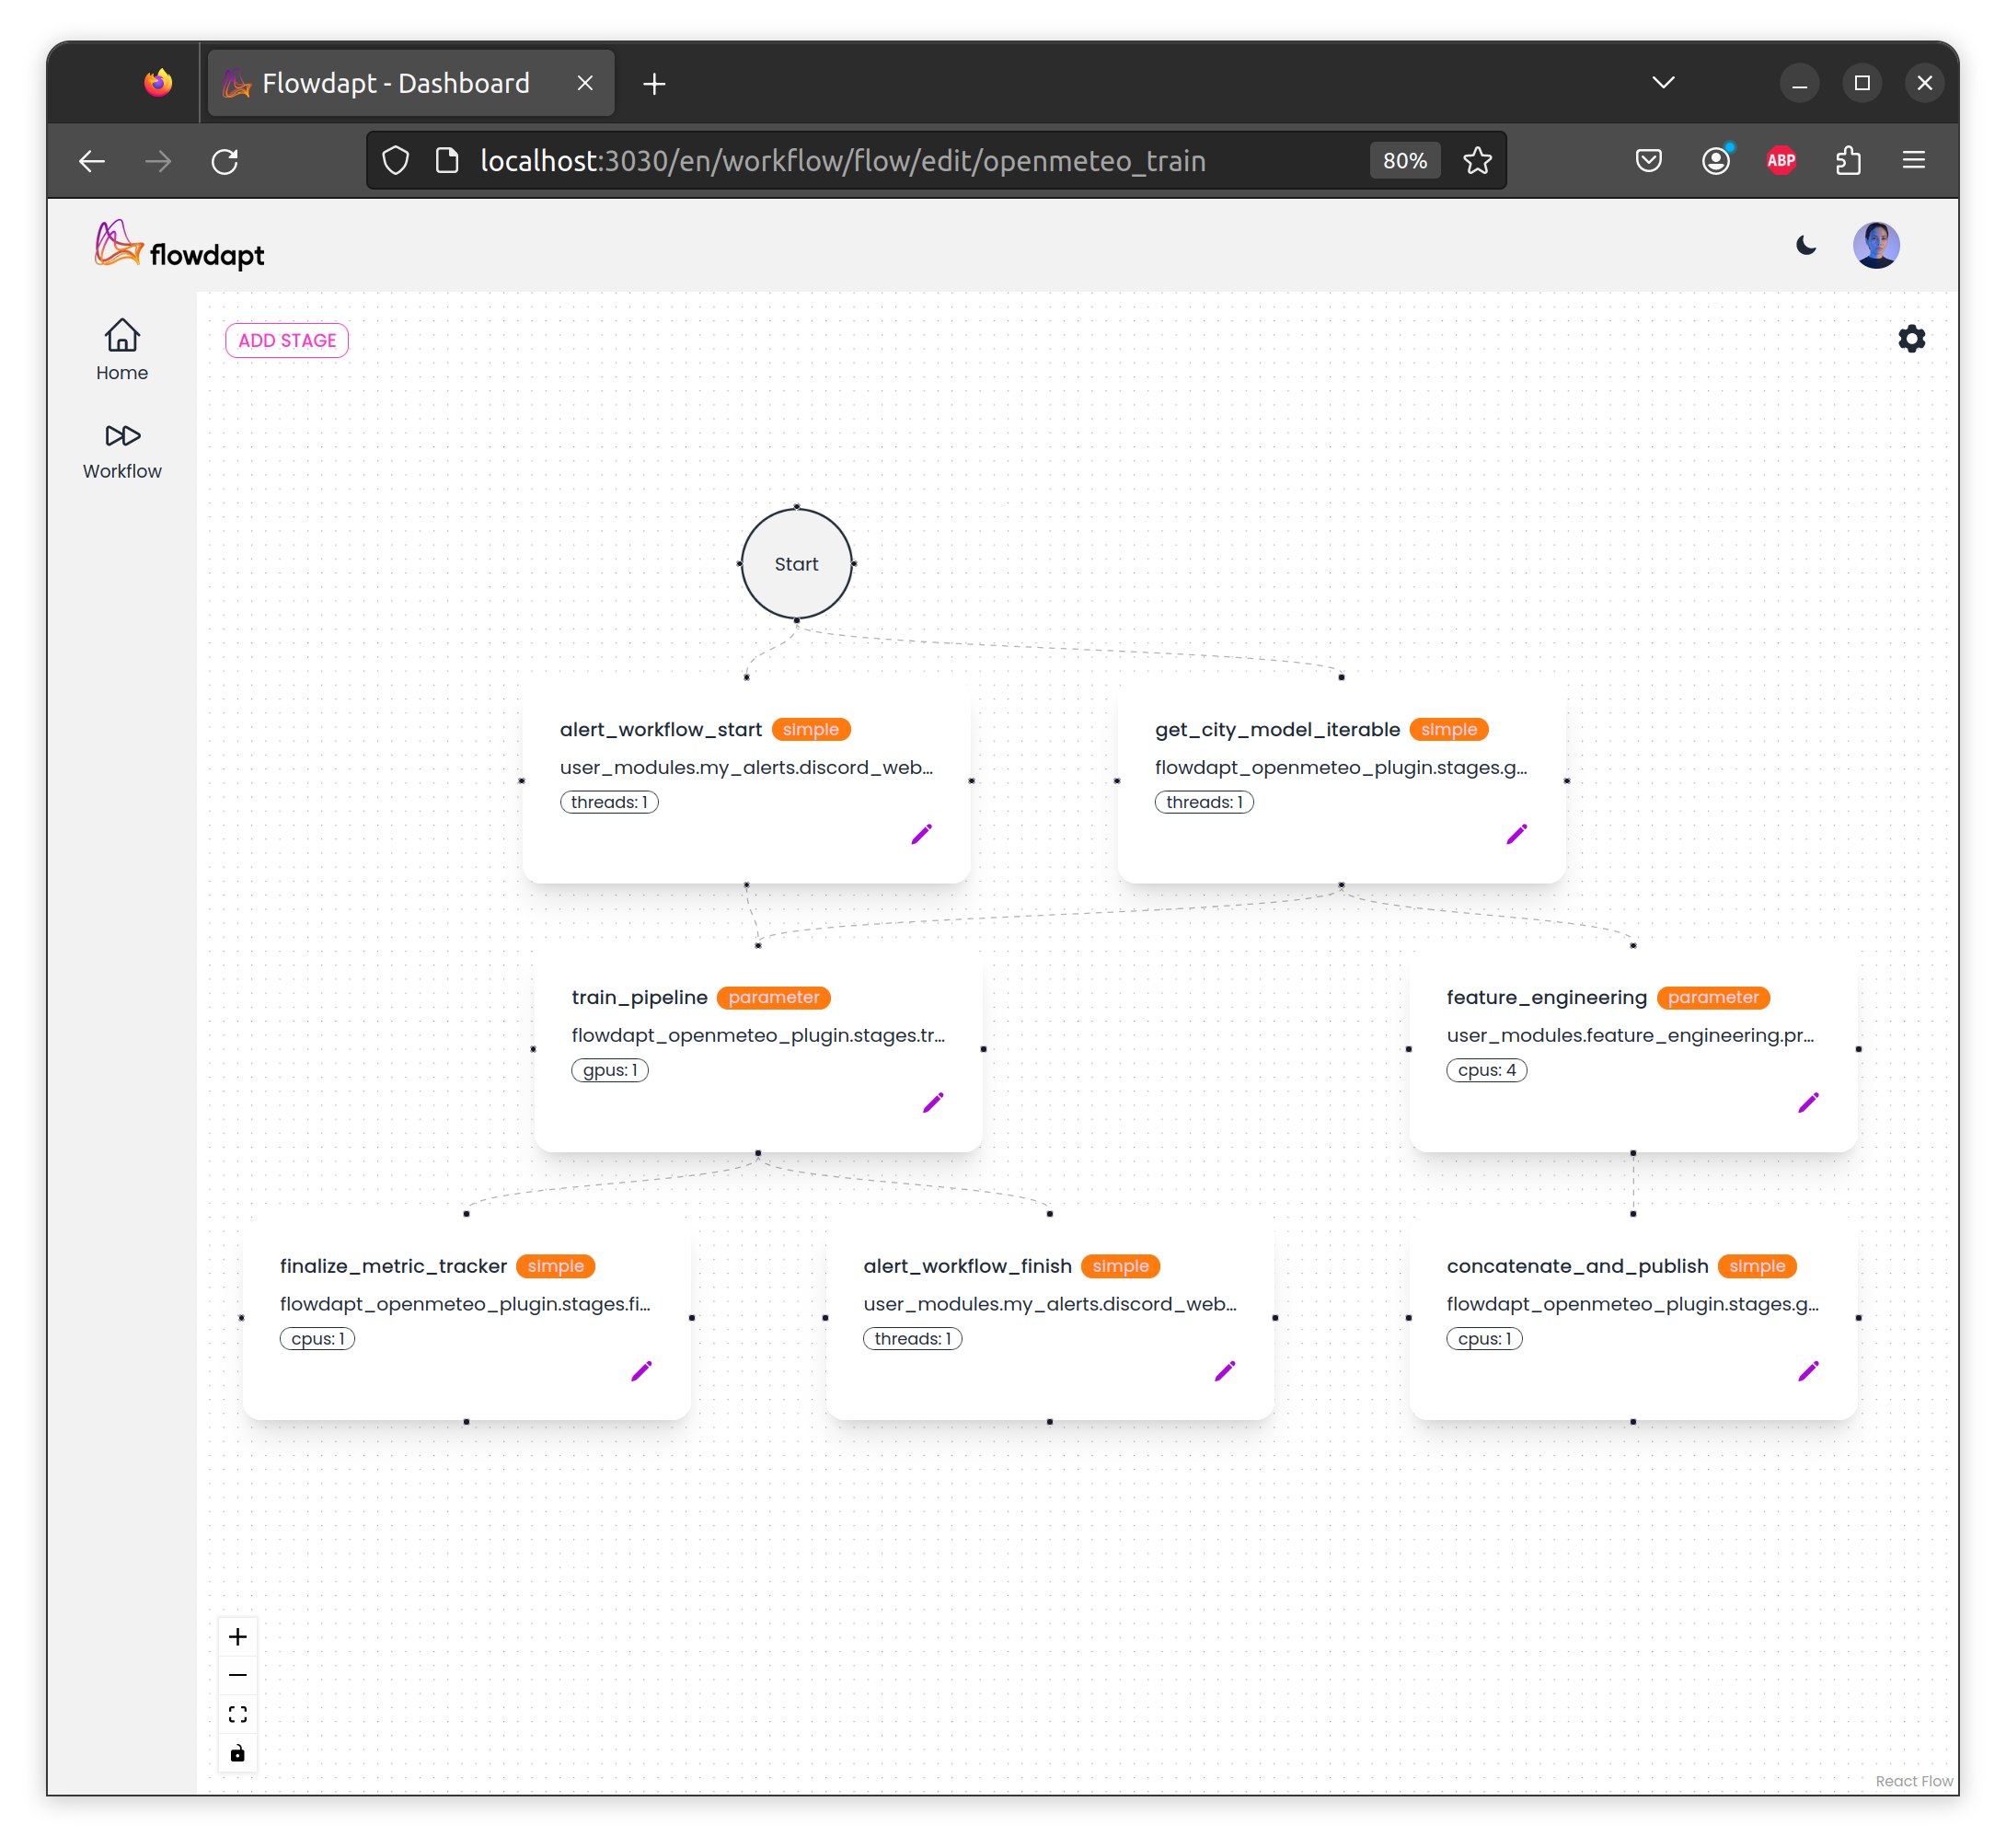
The flowdapt workflow dashboard allows you to build and deploy complex workflows using a graphical interface as shown here:
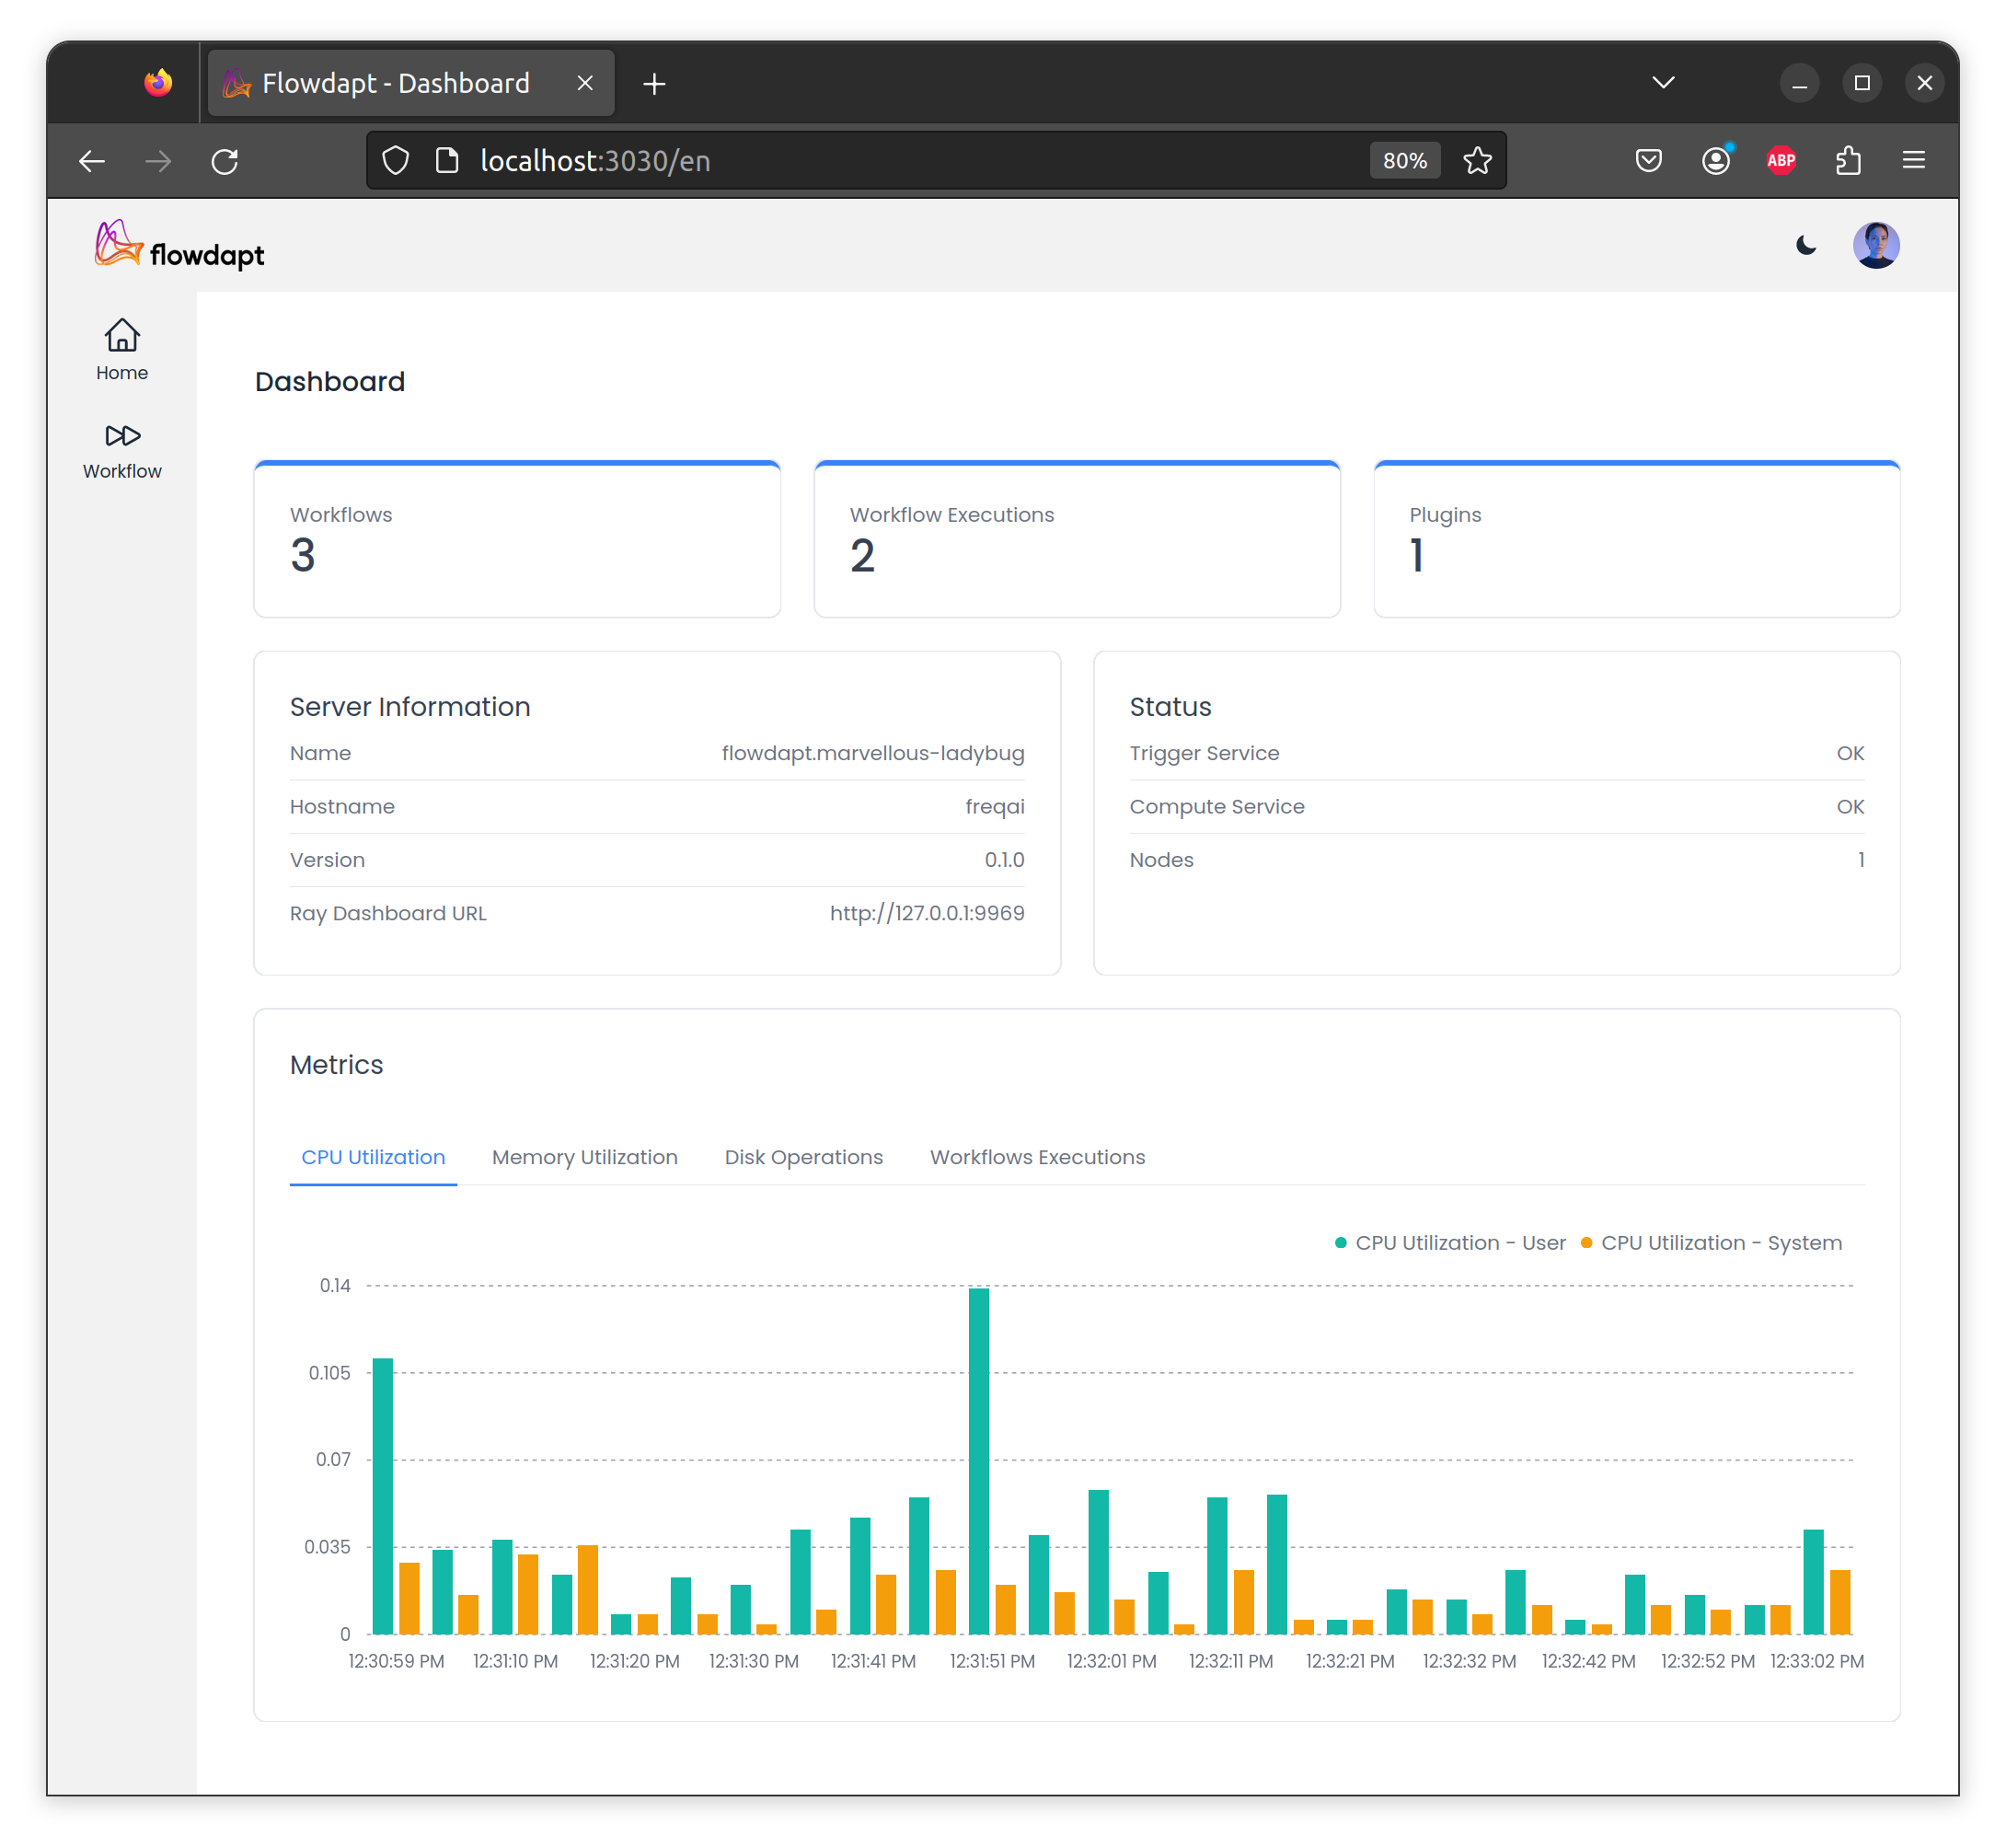
and monitor key health metrics of your deployment:
Installation
The Flowdapt workflow dashboard can be installed using the following instructions:
Step 1: Node.js Verification and Installation
Check if Node.js is installed on your machine by opening a terminal (Command Prompt in Windows or Terminal in MacOS/Linux) and running the command node -v. This will display the version of Node.js installed. If successful, you should see output like v18.15.0.
If Node.js is not installed, download it from the official Node.js website and follow the prompts to install it.
Step 2: Clone the Repository
Clone the project repository from the provided link (contact us at Emergent Methods for early acccess).
Step 3: Install Required Packages
Navigate to the root directory of the repository in the terminal and run npm i to install all the required packages.
Step 4: Verify API Address
By default, the .env file contains the default API address. If you need to modify the API address, create a .env.local file and define the environment-specific variables there.
Step 5: Start Flowdapt
Start Flowdapt to make the API endpoint available.
Step 6: Start the Dashboard
You have two options for starting the dashboard:
-
Developer Mode: Run
npm run devto start the server in developer mode. Changes made to the code will automatically reflect in your browser. -
Production Mode: Run
npm run buildfollowed bynpm run start. Thebuildcommand creates the build for the project, and thestartcommand serves the dashboard on a http port.
Executor dashboards
Deeper cluster specific metrics and task graphs can be visualized using the executor dashboards. These dashboards are automatically exposed when the Flowdapt server is launched. The two executors currently available, Ray dashbord or the Dask dashboard will be automatically available on a local server (typically at 127.0.0.1:9969). These dashboards are most useful for identifying weak parallelization points in a workflow and for tracking bugs back to origin tasks/functions. Additionally, this dashboard provides active resource usage and computational graphs. We encourage users to visit the respective documentations for more details about various functionalities.